 Choose language
< Return to main menu
Choose language


News & Events

Services & Solutions
News & Events
Career
Platform
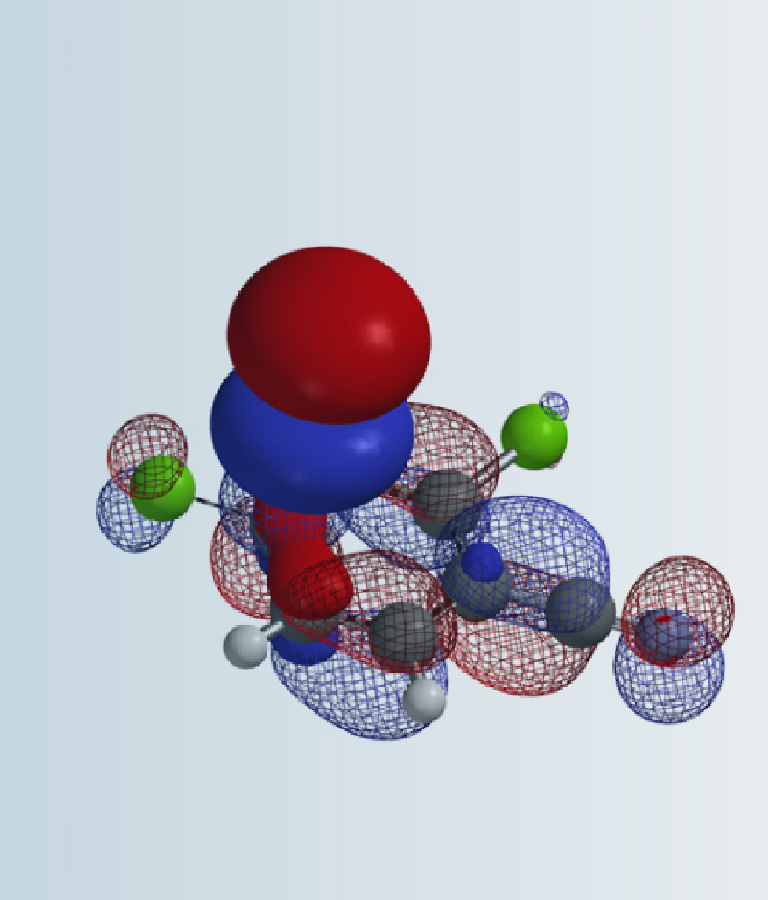
Magical Power of Quantum Mechanics
Events
News
Magical Power of Quantum Mechanics
In organic synthesis, we often need to estimate acidity of our substrates to choose a proper base for deprotonation. For simple compounds we refer to the pKa table. But for complex heterocyclic molecules, such as substrate (1) shown in Figure 1, in which two acidic hydrogens, H-1 and H-2, are susceptible be deprotonated, it could be challenging to predict accurately.
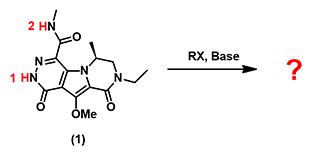
Figure 1. Selective deprotonation of (1) for subsequent alkylation
In this article, we would like to introduce the use of Electrostatic Potential Map (ESP Map) to correlate with acidity and then use relative differences in electrostatic potential values to predict the regioselectivity of deprotonation.
Electrostatic potential is the interaction energy of a point positive charge with the nuclei and electrons of a molecule. The value of electrostatic potential depends on the location of the point positive charge. If the point positive charge is placed in a region of excess positive charge (an electron-deficient region), the point charge-molecule interaction is repulsive and the electrostatic potential will be positive. On the contrary, if the point positive charge is placed in a region of excess negative charge (an electron-rich region), the interaction is attractive and the electrostatic potential will be negative. [2]
By mapping the electrostatic potential onto an electron density surface (which represents the molecular shape), we could assess the charge distributions on molecules and identify the most electron deficient region(s).
The maximum values of the electrostatic potential in the vicinity of the acidic hydrogens are known to correlate with their pKa values. [3] Figure 2 shows experimental pKa values of a set of carboxylic acids plotted along with the calculated maximum values of the electrostatic potential (ESP Max). The ESP Max values could be determined from the ESP Map where the acidic hydrogen atoms are located, as they are the most electron deficient regions within these molecules.
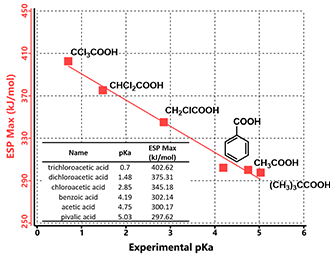
Figure 2. Correlations between pKas and ESP Max values of carboxylic acids
These ESP Max values correlate almost linearly with reported experimental pKa values of the carboxylic acids. The more positive of the ESP Max value, the lower the pKa, the stronger the acid is.
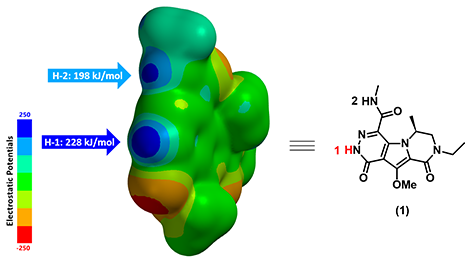
Figure 3. Electrostatic Potential Map (ESP Map, electrostatic potential of a molecule mapped onto its electron density surface) of substrate (1)
Figure 3 displays the calculated ESP Map of substrate (1). By default, red color depicts regions of more negative electrostatic potentials (electron-rich) whereas blue color depicts regions of more positive electrostatic potentials (electron-deficient). The ESP Max value at H-1 site (228 kJ/mol) is much larger than the value at H-2 site (198 kJ/mol), suggesting that H-1 is significantly more acidic than H-2. We therefore predict that H-1 could be selectively deprotonated. Indeed we observed only the anticipated alkylated product experimentally.
In summary, QM-calculated ESP Map enables us to estimate the relative acidity of deprotonable hydrogens, and therefore to predict their selective deprotonation with high confidence. This method to estimate relative acidity is routinely being used in our retrosynthetic planning.
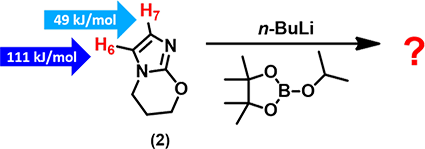
In substrate (2), both H-6 and H-7 are susceptible to deprotonation with n-butyl lithium. With the calculated ESP values shown in the figure, we could readily predict which hydrogen will be deprotonated, and as such, the structure of the resultant boronate ester. It is quite straight forward.
References:
[1] W. Hehre and S. Ohlinger, A Guide to Molecular Mechanics and Quantum Chemical Calculations. Irvine, CA, USA: Wavefunction, Inc., 2003.
[2] Spartan’18 Tutorial and User’s Guide. Irvine, CA, USA: Wavefunction, Inc. 2019; pp 116-118, 546-551.
[3] S. Liu & L.G. Pedersen, J. Phys. Chem. A. 2009, 113, 3648.