 Choose language
< Return to main menu
Choose language


News & Events

Services & Solutions
News & Events
Career
Platform
Magical Power of Quantum Mechanics
Events
News
Magical Power of Quantum Mechanics
For formation of C(sp3)-N bonds, direct addition of nitrogen-containing fragments to olefins is complementary to classical SN2 reactions. Metal-catalyzed direct hydroamination of alkenes has been extensively studied[1]; in contrast, hydroaminomethylation, the addition of a hydrogen and a (methyleneamino) unit across an olefin, has received significantly less attention.
Recently, Nuno Maulide's group reported the use of Eschenmoser salt for an acid-catalyzed hydroaminomethylation of unactivated alkenes and alkynes[2]. A broadly applicable approach with readily available substrates and reagents, excellent functional group compatibility and high selectivity. Compared to the classical SN2 approach, this reaction eliminates potential risks of formation of dimethyl or quaternary ammonium by-products. Reaction is assumed to proceed via an electrophilic addition followed by an [1,5]-H shift, a two steps mechanism:
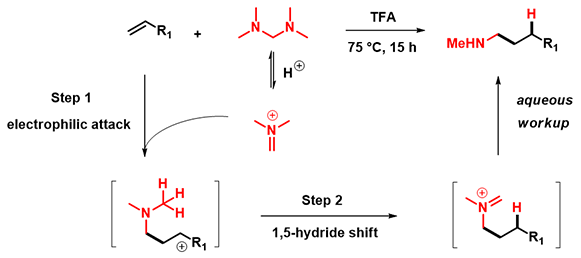
Figure 1: Reaction mechanism suggested in the article
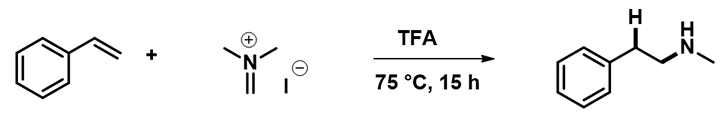
We selected the reaction of styrene and Eschenmoser salt, reported in the publication, for our computational studies.
Based on the reaction mechanism proposed in the paper, the first step is electrophilic addition of Eschenmoser salt to styrene. Site of the reaction is at the terminal carbon of the olefin. As such, we calculated HOMO and HOMO Map for styrene and LUMO and LUMO Map for iminium ion, as shown in Figure 2[3].
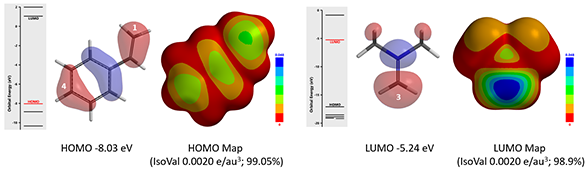
Figure 2: HOMO and HOMO map for styrene and LUMO and LUMO map for iminium ion
HOMO and LUMO energy difference between styrene (-8.03 eV) and the iminium ion (-5.24 eV) is only 2.79 eV, suggesting that the reaction will proceed readily[4]. HOMO of styrene concentrates on substitutable carbon at C-1 and C-4 positions. Its HOMO map indicates that the lobe on C-1 is more exposed, suggesting that C-1 will interact selectively with electrophilic agents. Moreover, LUMO of the iminium ion is mainly distributed on the methylene carbon atom, the reaction center. Results of the above frontier orbital analyses are consistent with sites of reaction reported in the article.
Next, we calculated for the reaction energy profile for the electrophilic addition step, with C-1 of styrene set 3.5 Å away from C-3 of iminium ion and moving closer to one another with a step size of 0.1 Å, as shown in Figure 3 below. Activation energy is estimated to be about 13 kcal/mol, consistent with experimental conditions. Transition state and IR calculations of the peak energy structure B showed one and only one imaginary frequency at i299 cm-1, supportive of the mechanism postulated[5].
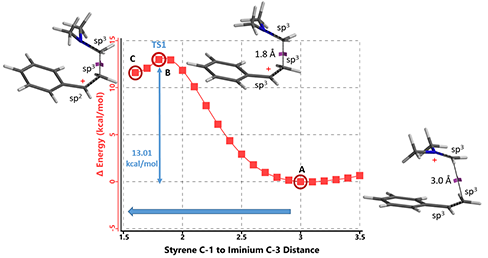
Figure 3: Step 1 Reaction Energy Profile
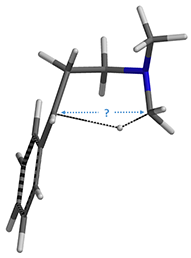
Figure 4: Step 2, conformer D
Step 2, for this intramolecular [1,5]-H shift, we did not know how far to put the C-1 and C-5 carbons apart to set up for a reaction energy profile calculation (Figure 4). We used an alternative computational strategy: calculate for the transition state of the H-shift first, then use the transition state structure for intrinsic reaction coordinate (IRC) calculation to establish the energy profile. IRC is an important concept and tool for quantum chemical calculation by starting from the transition state, bifurcating, and connecting reactants and products, to calculate for the reaction potential energy curve (Figure 5)[6].
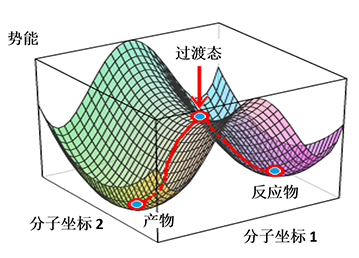
Figure 5: Schematic representation of Intrinsic Reaction Coordinate (IRC)
For this example we varied the C-1 to C-5 distance for a few transition state calculations, cumulating to the identification of the transition state structure E (Figure 6), with one and only one imaginary frequency at i387 cm-1, arriving at a reasonable transition state structure[5].
Figure 6: Step 2 transition state E (TS2) ifrequency i387 cm-1
Starting from this transition state structure E, we calculated for IRC (Figure 7)[6], reached back to starting and arrived at product structures of the [1,5]-H shift step, and obtained the energy profile (Figure 7). The reaction starts from structure D and arrives at product structure F via transition state E. The activation energy required for the reaction is ~0.83 kcal/mol.
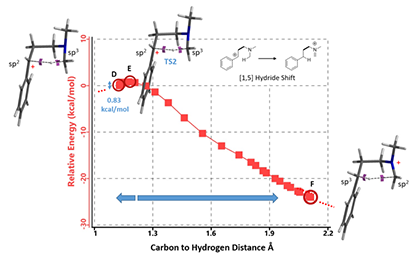
Figure 7: [1,5]-H shift IRC. See footnote [7] for changes in electron density during H shift
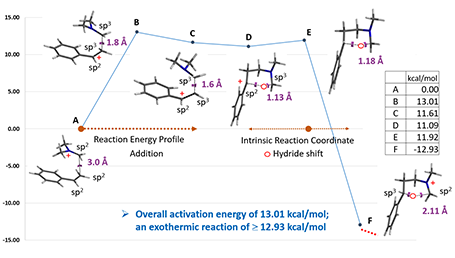
Figure 8. Overall reaction energy profile of styrene hydroaminomethylation
Next is to connect the energy profiles of step 1 and 2 together. C and D are the same intermediate structure, differing in their conformation. QM relative energy calculation of them indicates that conformer C is 0.52 kcal/mol higher in energy than conformer D.
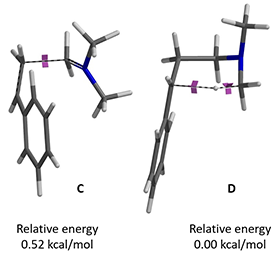
Figure 9. Relative energy of conformers C and D
Overall, hydroaminomethylation of styrene is exothermic (-12.93 kcal/mol) with step 1 as the rate limiting step having an activation energy of 13.01 kcal/mol. And the product F is an iminium ion, ready for further functionalization.
In summary, our FMO analyses of the styrene and iminium ion for step 1 are consistent with sites of reaction, activation energy and transition state of the electrophilic addition correlates with experimental conditions. Results from direct transition state and IRC calculations of step 2, [1,5]-H shift, support the mechanism proposed in the literature.
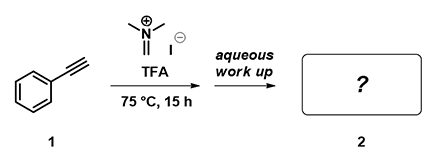
Figure 10: Reaction of phenylacetylene with iminium ion
In addition to alkenes, alkynes can undergo hydroaminomethylation under the same conditions. HOMO (-8.30 eV) and HOMO map of phenylacetylene are shown in Figure 11 below. What is the likely product of the reaction? Will the resultant product have a cis or a trans geometry?
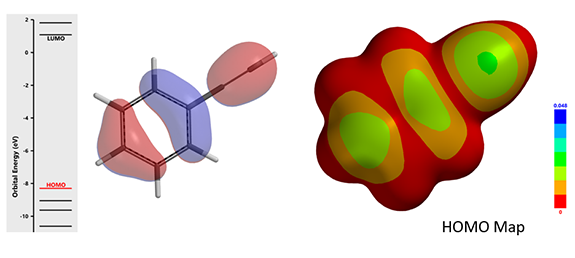
Figure 11: HOMO (-8.30 eV) and HOMO Map for Phenylacetylene (IsoVal 0.0020 e/au3; 99.05%)
References:
[1] C. Michon, M.-A. Abadie, F. Medina, F. Agbossou-Niedercorn, J. Organomet. Chem., 2017, 847, 13. J.P. Huo, G.Z. He, W.L. Chen, X.H. Hu, Q.J. Deng, D.C. Chen, BMC Chemistry, 2019, 13, article 89.
[2] D. Kaiser, V. Tona, C.R. Goncalves, S. Shaaban, A. Oppedisano, N. Maulide. Angew. Chem. Int. Ed. 2019, 58, 14639.
[3] Spartan'20 Tutorial and User's Guide (2020). Irvine, CA, USA: Wavefunction, Inc. pp. 60 & 365.
LUMO map is an overlay of the absolute value of the lowest unoccupied molecular orbital onto an electron density surface. By convention, colors near blue indicate high concentration of the LUMO, while colors near red indicate low concentration. Given that the LUMO designates space available for a pair of electrons, a LUMO map indicates where nucleophilic attack would likely occur. Similar for HOMO map.
[4] a) L.G. Zhuo, W. Liao, Z.X. Yu, Asian J. Org. Chem. 2012, 1, 336. b) See Chapter 25, Assessing Reactivity with LUMO and HOMO Energy Gap.
[5] a) Spartan'20 Tutorial and User's Guide (2020). Irvine, CA, USA: Wavefunction, Inc. pp. 158, 442, 459 & 536. b) See Chapters 22 and 24, Exploring the Reaction Mechanism of Menke Nitration and A QM Study of the Reaction Mechanism of Diazotransfer.
[6] K. Fukui, Acc. Chem. Res. 1981, 14, 368. S. Maeda, Y. Harabuchi, Y. Ono, T. Taketsugu, K. Morokuma, Int. J. Quantum Chem. 2015, 115, 258.
Intrinsic reaction coordinate was proposed by Fukui in 1970 as a path of chemical reactions. It is the mass-weighted steepest descent paths on the potential energy surface, starting from the transition structure, that is, first-order saddle point. IRC has been used extensively in analysis and prediction of mechanisms of a variety of chemical reactions.
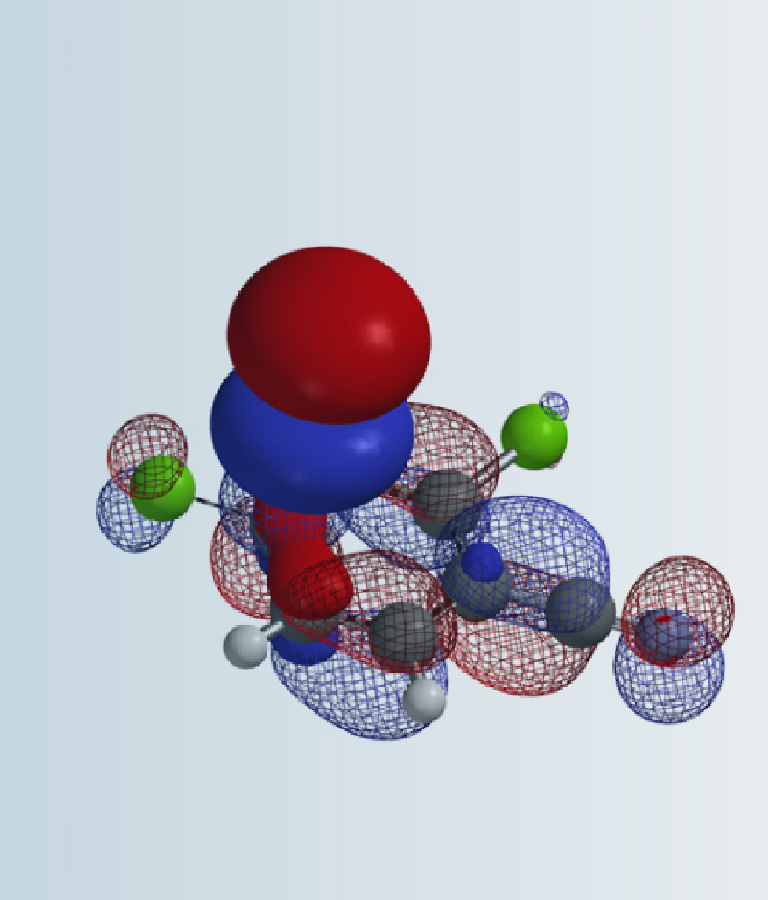
[7] Shown on Figure 12 is electron density of transition state E in [1,5]-H shift. Electron density is associated with the hydrogen as it migrates from the amino methyl carbon to the benzylic carbon. (Other than the migrating hydrogen, all the other hydrogens on the molecule are hidden).
Figure 12. Electron density map of the TS E in [1,5]-H shift from D to F
(IsoVal 0.0457 e/au3; 86%)
This article is written and edited by Yexia Zhang, Liting Dong, Tommy Lai, Guqin Shi, Yongsheng Chen, John S. Wai